
A Review of U.S. Electricity Generation & Demand in 2025: A Solar & Battery Storage Success Story
Last week, we reviewed current trends and figures in Artificial Intelligence (“AI”) adoption, both in the U.S. and worldwide. One of our key observations, based on expert analysis around the industry, was that increasing energy demand from data centers introduces meaningful retail electricity price risk due to the prospective overbuilding of energy infrastructure. Although electricity demand is bound to continue rising, where and by how much that demand increases is critically important for proper electric system planning and investment.
Recent commentary has highlighted concerns around increased coal-fired electricity generation, driven in part by postponed coal plant retirements and elevated natural gas prices. These dynamics have renewed concerns related to pollution and greenhouse gas emissions within the power sector.
However, there is a major countervailing story—one that offers reason for optimism. Utility-scale solar was the fastest-growing source of electricity generation in 2025, and by a wide margin. In fact, 61% of new electricity demand, including AI data center load, was supplied by solar generation in 2025. Utility-scale solar has been the fastest-growing source of electricity generation in the United States for several consecutive years, a trend that continued into 2025 as solar supplied the largest share of new electricity demand.
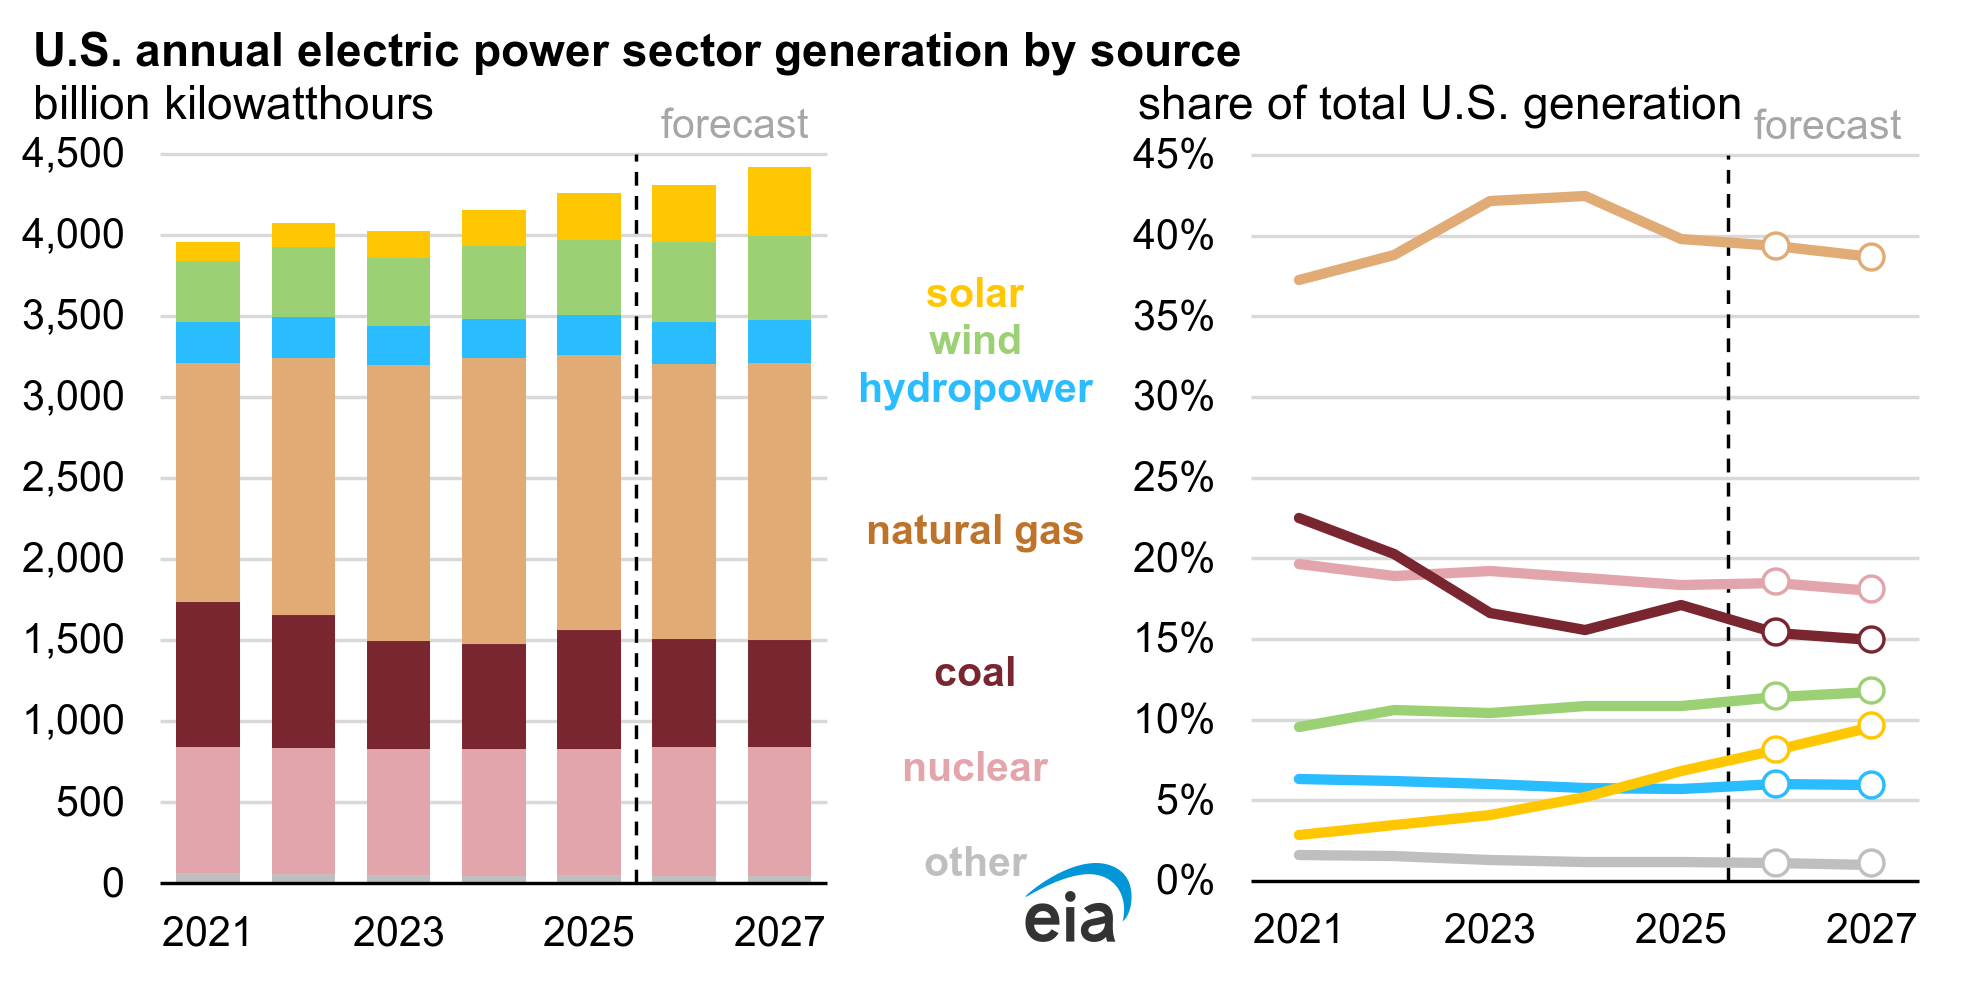
Image Credit: U.S. Energy Information Administration
It appears that the early-2020s utility-scale solar interconnection queue challenges facing system and transmission operators, as well as some utilities, have begun to ease, with some projects moving beyond earlier bottlenecks and reaching commercial operation. While the total interconnection backlog is finally shrinking, “speed to market” has not fully recovered. Many new projects still face development timelines of roughly five years from queue entry to commercial operation—nearly double the timelines commonly observed a decade ago.
This is largely due to the sheer number of interconnection applications nationwide, as well as speculative queue positioning by some developers—a dynamic observed in both renewable generation and large-load interconnection requests, such as data centers.
Renewable developers will submit applications once land rights have been secured with a seller or lessor, depending on the project arrangement. This claims their spot or “place-in-line” within the system/transmission operator or utility interconnection queue system, which is often first-come, first-served.
However, there are significant difficulties seeing projects through to completion because of a variety of factors, including but not limited to:
interconnection bottlenecks
insufficient grid capacity
rising costs
environmental hurdles
lack of firm power purchase agreements (PPAs)
Even with applications that are submitted early, developers must still meet "ready-to-build" requirements for financing and full approval, a process made harder by utility delays and complex grid studies. On the whole, it’s clear that the uncertainty related to both types of interconnections, AI data center load and solar generation interconnections, significantly impacts system/transmission operators and utilities. Nevertheless, even with the setbacks in the first half of the decade, solar power generation continues to grow and had an incredible year in 2025.
According to an analysis completed by Ember Energy, a global clean energy think tank, and based off of U.S. Energy Information Administration (“EIA”) data, “electricity demand rose by 3.1% (or 135 TWh)”. As discussed in previous blog posts, electricity generation and demand must be balanced at all times. Unlike previous years that saw limited battery storage development, battery additions in 2025 doubled, reaching 26.2 GW—approaching the scale of new solar capacity additions (29.2 GW). While capacity additions are measured in gigawatts (GW), actual electricity produced is measured in terawatt-hours (TWh). Both metrics are relevant when assessing system impacts. For the calendar year 2025, this meant that significantly more energy could be stored in batteries and discharged during evening peaks. Even with round-trip efficiencies around 86%, solar and solar-plus-storage generation increased 27% compared to 2024, totaling 83 TWh.
Regional systems in Texas, the Midwest, and the Mid-Atlantic were among the most popular regions for data center development in recent years. Even as areas ranking in the top five for lowest wholesale electricity costs, often popular with data center developers, solar generation was still able to dominate new energy supply in 2025. For the three respective systems, ERCOT, MISO and PJM, new solar energy generation supplied 81%, 81%, and 33% of new incremental demand. As discussed, the battery storage additions also enabled solar energy to be discharged after peak sun hours, contributing to energy supply during evenings.
Interestingly, the 2025 solar energy generation story did not see an increase in capacity additions or growth in additions of solar installations—that actually reduced by 6%. With the rate of solar generation growth slowing, it’s clear that battery storage really shined during 2025. With marginal production costs near zero, excess solar energy is an incredible source of generation for energy storage systems. It’s no surprise that the 26.2 GW of battery storage growth amounted to a 133% increase. Lazard, the investment bank, reported that onshore wind and solar energy generation continue their competitiveness, even without subsidies on a levelized cost basis, in their annual report from June of 2025. In fact, on a per kWh basis, solar-plus-storage hovers within about $2 of gas combined cycle generation, on the low end. All this to say, it’s clear that it’s not only important how much it costs to produce a kWh but also when it’s supplied.
Overall, Peak Utility Advisors continues to follow the renewable energy transition and its effects on energy costs. Hopefully, this article shows that there are still tremendous reasons for optimism, even with the recent increase in electricity demand (+3.1%) and greenhouse gas (“GHG”) emissions (+2.4%). Although GHG emissions did grow faster than the economy, often referred to as “economic decoupling failure”, 2025 emissions were still 6% lower than pre-pandemic (2019) levels and 18% below 2005 levels. In a year that saw drastic increases in Liquified Natural Gas (“LNG”) exports (raising the cost of NG compared to coal), high heating demand due to polar vortexes, and the aforementioned power sector demand increase, 27% growth in the energy produced by America’s second largest renewable technology is a tremendous leap forward. When virtually all other technologies, excluding wind and solar, are seeing reductions in the share of energy produced, the U.S. electricity grid is being set up for a cleaner and more cost-effective future.